Economics
Economics
Economics
Economics
Brown JPPE
Cannabis
Latent Effects of Cannabis Legalization: Racial Disproportionality and Disparity in Washington State Drug Convictions, 2000-2015
Kaid Ray-Tipton
University of Washington
Author
Danai Benopoulou
Matthew Dowling
Bastien Ibri
Shreya Raghunandan
Editors
Spring 2018
Understanding if racial disparities in drug convictions decreased post the implementation of cannabis legalization in Washington state.


Introduction
There has been a great amount of research analyzing racial disparities in drug arrests (Beckett, Nyrop, Pfingst and Bowen, 2005; Kutateladze, Andiloro, Johnson and Spohn, 2014). Findings show that black people have disproportionate arrest rates compared to Whites. In fact, “Blacks are 3.73 times more likely than Whites to be arrested for marijuana possession” (ACLU, 2013). These statistics are surprising given that Blacks and Whites use cannabis at a comparable rate (ACLU, 2013). Hispanic communities are also impacted. Racial disparities in drug crimes in this group are harder to measure quantitatively because some agencies group Hispanic or Latinos with Whites. This causes the White conviction rate to increase, thus deflating the racial disparity present. In New York City where Latino arrest rates are available, “Latinos are arrested at 2.5 times the rates of Whites for marijuana possession” (ACLU, 2013).
Richard Nixon’s declaration for the “War on Drugs” that began in the 1970’s has had many negative latent effects on communities of color and has contributed greatly to racial disproportionality in mass incarceration (Sharp, 1994). For example, “arrest for marijuana possession… accounted for nearly 80 percent of the growth in drug arrest in the 1990s” (Alexander, 2010). Images within media have reinforced the link between people of color and their involvement with drugs (Bullock, Wyche and Williams, 2001). These socially constructed depictions have influenced prejudices and stereotypes which in turn create implicit biases. These biases have been shown to have profound effects on police enforcement tactics and decision making (Levinson, 2007).
Currently, police across the nation have the discretion to stop and search people under “reasonable suspicion” that an individual may be in possession of illegal drugs (Yankah, 2011). These so called “Terry” stops allow police officers to use the notion of reasonable suspicion to stop and frisk individuals (Terry v. Ohio, 392 U.S. 1, 1968). Such inquiries frequently rely on police officers’ own intuition - an intuition often affected by the aforementioned implicit biases. Scholars have suggested that this policing is not evenly distributed among neighborhoods and across socioeconomic statuses. To be more specific, racially and ethnically diverse areas may be subject to over-policing while predominantly white neighborhoods may be more likely to be under-policed (Beckett, Nyrop and Pfingst, 2006). Therefore, more police enforcement in communities of color leads to more stops and searches among people of color. These outdoor drug busts may lead to a disproportionate increase in convictions for Blacks and Hispanics. Blacks are disproportionately convicted for cannabis related offenses, which disrupts many areas of life including family, employment opportunities, housing, and well-being (Massey, 2007). It is important to note that even stops and searches that yield no results for the police may lead to continued harassment and embarrassment for members of the community due to the “War or Drugs”.
Recently, cannabis has been highly debated as a substance that could be legalized for medical and/or recreational purposes (Coulkins, Kilmer, Kleiman, MacCoun, Midgette, Oglesby, Paucula and Reuter, 2015). The federal government has yet to lift the national prohibition of cannabis but many states have begun to revise their laws regarding it. There are currently 23 states and the U.S. territories of Guam and Puerto Rico that have passed laws to legalize medical cannabis. There are only nine states and the District of Columbia that have legalized recreational use as well; these states include Alaska, California, Colorado, Oregon, Maine, Massachusetts, Nevada, Vermont, and Washington (Guttmannova, Lee, Kilmer, Fleming, Rhew, Kosterman and Larimer, 2016). Cannabis being decriminalized in these states may have profuse positive outcomes for people of color. Policing would be reduced for cannabis use and possession within these states. Blacks and Hispanics in these areas may be subject to fewer convictions by police because of the nature of the fledgling laws.
In this paper, I will analyze latent outcomes of the legalization of cannabis. More specifically, I will examine racial disproportionality in drug conviction pre and post the legalization of cannabis for recreational use in King County and Washington State. I expect to find reductions in racial disproportionality in drug convictions post cannabis legalization at the county and state level.
Background
History of Cannabis in the United States and Its Links to Race/Ethnicity
Scholars suggest that cannabis was first brought to the United States in the beginning of the 1600s. The Jamestown settlers primarily used this plant in hemp production and cultivation until around 1850 (Anderson, Hansen and Rees, 2013). The uses for hemp ranged from clothing and oil to edible nuts. Subsequently following the end of hemp cultivation was the use of hemp for medicinal purposes. The use of herbal medicine did not last very long. As the alcohol prohibition gained support in the 1850s, so did the movement to outlaw cannabis.
The first prohibition of recreational cannabis use was passed in 1913 by California. By 1936, the rest of the 47 states decided to do the same (Anderson, Hansen and I. Rees, 2013). In the years to come, these policies led to immense consequences for the consumer, including the label of felon with a stigma that restricted occupational attainment, and included hefty incarceration time and large monetary sanctions. For instance, possessing one joint (cannabis cigarette) in Arizona could lead to up to 10 years in prison with a fine of $50,000 (Inciardi, 1981). Policies and laws such as these became monolithic because “those who have actively promoted these laws, the moral entrepreneurs of drug legislation, have relied on racial slurs and allusions to bolster their arguments for criminal controls” (Provine, 2007).
In 1970, cannabis was classified as a Schedule I substance along with heroin and LSD. For a substance to be listed as a Schedule I drug, it must not be accepted for medical use, have a high potential for abuse, and be considered a dangerous drug that can cause psychological and physical dependence (United States Drug Enforcement Administration, 2015). As time moved on, groups began to consider cannabis for medicinal purposes. The Food and Drug Administration began to allow cannabis for medical use in 1978. The number of medical cannabis patients flourished and California eventually passed the Compassionate Use Act in 1996 to allow for personal use of the plant (N. Yankah, 2011). Two years after, Washington State passed Initiative 692 titled Washington State Medical Use of Marijuana Act (Washington State Medical Association). This allowed for the growing, possession, sale, and use of cannabis for medical patients.
It is worth noting that this initial stance against cannabis did not necessarily happen out of fear of the potential negative effects of the drug, such as addictive, psychological, and physiological damage. Instead, the prohibition on cannabis developed as a result of anti-minority feeling (Bonnie and Whitebread, 1970). Inciardi (1981) conducted a social constructionist analysis of newspapers about cannabis published in the late 1800s and early 1900s and showed that headlines negatively linked cannabis with communities of color. For example, the New York Times published an article in 1972 titled “Mexican Family Go Insane”. This particular article detailed how a widow and her four children accidentally ate cannabis as part of their vegetables for dinner. In the neighbor’s account, they described hearing “crazed laughter” and rushed to the house to see the entire family “insane”. The doctors said that there would be no hope for the mother and children and that they would be insane for the rest of their lives.
These early depictions linking race and drugs have lasting effects on media consumers. For example, results from a study done in 1995 asked respondents to imagine what a typical drug user looks like. Analysis indicates that 95% of the respondents thought of an African American person (Burston, Jones and Robertson-Saunders, 1995). The acceptability of illegal substance tended to rely on the social position of the consumers (H. Skolnick and Dombrink, 1978). The perceived deviance of cannabis intensified once linked with racial/ethnic minorities. Whites were seen as upper class and angelic. People of color were paired with a lower social class, at times considered non-human in the early 1900s. This helps explain the overstated deviance of cannabis. The deviance also increased when the effects were dramatized and exaggerated. In 1936, the American Journal of Nursing said that a cannabis user may “suddenly turn with murderous violence upon whomever is nearest to him. He will turn amuck with knife, axe, gun, or anything else that is close at hand, and will kill or maim without any reason" (Musto, 1991). Articles such as these from professionals are an example of the control around cannabis use and how it was perceived by the general public.
Cannabis Laws in King County and Washington State and Implications for 2012
As Seattle is the most populated city in King County and thus Washington State, I will give emphasis to their policies and the city will have the most influence per this discussion. In 2003, Seattle, Washington voters passed the Marijuana Law Enforcement or “Initiative 75”. This initiative required all cannabis offenses for adult personal use to be the lowest priority for the Seattle Police Department (SPD) (Atherly and Baird, 2014). This change in the Seattle municipal code was a huge step towards decriminalization of cannabis in Washington State (Seattle, Washington Municipal code 12A.20.060).
Subsequently, on November 6th 2012, Washington Initiative 502 was approved by a majority vote (Washington State Liquor and Cannabis Board, 2015). The cannabis reform had many different components that took over a year to be fully established. The passing of I 502 legalized the recreational use of cannabis for individuals 21 and older. A 21 year old may possess up to one ounce of usable cannabis, seven grams of cannabis concentrates/extracts, 16 ounces of cannabis infused in a solid form, up to 72 ounces of cannabis infused in liquid form, and also paraphernalia related to cannabis. Only cannabis producers, processors, and retailers with a license are permitted to distribute cannabis.
Seattle’s massive drug market has been analyzed and researched during these years to learn if there are disparities among race and ethnicities in drug convictions. Katherine Beckett demonstrates that Seattle is unique in many ways. During the 2000s, Seattle was estimated to have the fourth largest drug market in the country. The predominantly white city has a white population of about 70% and 8% black population. Despite the low proportion of Blacks, during a 28-month investigation in Seattle, black people represented 51.1% of drug violation arrests (Beckett, Nyrop, Pfingst and Bowen, 2005).
Beckett et. al (2005) attribute most of these arrests to the focus on crack cocaine by the SPD. This may be due to the fact that crack cocaine has been represented through media as a “Black” drug (Kutateladze, Andiloro, Johnson and Spohn, 2014). Another reason for the high number of arrests is explained by the location of the drug market. Beckett et. al suggest that the SPD tends to focus on racially diverse outdoor drug markets, such as Downtown Seattle, compared to indoor and/or outdoor White drug markets, such as a neighborhood named Capitol Hill (Beckett, Nyrop and Pfingst, 2006). Previous research on Seattle’s drug market indicates that Blacks and Hispanics do not necessarily use or sell at higher rates than Whites, and yet, the SPD tends to focus on people of color. These results of racial disparity are consistent with other states as well. New York data shows that there are not just disproportionate percentages in possession/delivery arrests, but that Blacks and Hispanics are also more likely than Whites to be arrested for smoking cannabis in public and cannabis misdemeanor sales. They are also likely to spend more time in jail or prison for these cannabis offenses (Golub, D. Johnson and Dunlap, 2007).
Thus, it is clear that people of color—primarily Blacks and Hispanics—are being convicted disproportionately for drugs. Given that cannabis is legal in the state of Washington, I want to first investigate if the legalization has had a significant impact on the number of drug convictions for people of color. Second, I will examine how much of an impact a prior conviction has on one’s probability of being convicted of a drug offense for each race and ethnicity. This is done by first illustrating drug conviction rates and then examining drug convictions on the condition that the offender has a prior conviction. I also compare the results from King County to Washington as a whole. Lastly, I have computed multivariate logistic regressions to analyze the likelihood of being convicted of a drug offense in Washington State and King County. There have been reports that show cannabis-related arrests and convictions have decreased 81% between 2011 and 2014 (Drug Policy Alliance, 2015). There may be racial/ethnic differences, which I will attempt to contextualize. Subsequently, I will examine the association between the 2012 legalization of cannabis in Washington State and drug conviction rates between different racial/ethnic groups.
Methods
In the following analysis, I focus on racial/ethnic disproportionality and disparity in drug convictions in Washington State. Unfortunately, the data does not allow me to break out cannabis-related convictions from other types of drug convictions. I use the term disproportionate in convictions to refer to the overrepresentation of certain groups of defendants compared to their representation in the general population. I use the term disparity in convictions to refer to the portion of overrepresentation in convictions of one subgroup that can be explained by differences in the institutional processing of that specific racial/ethnic group as compared to other racial/ethnic groups. That is, racially motivated differences in processing and treatment explains disproportionate overrepresentation of certain groups in drug convictions.
Data
I examined all convictions within the state of Washington from January of 2000 to June of 2015 using data from the Database and Sentencing of Washington State Caseload Forecast Council Sentencing Data (Washington State Caseload Forecast Council, 2000-2015). My data includes 409,455 convictions of which 36,521 were drug convictions.
Variables
The dependent variable for analysis is drug conviction (1) or non-drug conviction (0). The primary independent variable of interest is the race/ethnicity of the convicted defendant. The racial/ethnic categories used are White (reference group), Black, Asian, Native American, and Hispanic.
The control variables included in the analysis are year of conviction, 2000 (reference year) to 2015, sex (0=Female, 1=Male), county of conviction (King County is reference county), and whether the defendant had any prior convictions (0=no prior offense, 1=prior offense).
Each of the control variables will be needed to test the robustness of the influence that the dependent variable has on the independent variable. The year of conviction is relevant because there are many fluctuations over the years in drug convictions. In 2012, Washington State legalized recreational cannabis usage for individuals over 21 years old. There are also gender differences in risk of arrest and convictions (Rodriguez, Curry and Lee, 2006). The counties of Washington State contain differing police practices and demographics. We predict that if a defendant had prior convictions, that might increase the likelihood of a subsequent conviction. These individuals may be targeted as the “usual suspects” (Kutateladze, Andiloro, Johnson and Spohn, 2014).
Analytical Approach
I compute several bivariate and multivariate logistic regression models. Model A includes all Washington State conviction cases, and Model B includes only convictions in King County, the largest county in this state. The full-state logistic bivariate regression is:
The logistic multivariate regression for Washington will be computed as:
The King County logistic bivariate regression is formulated as:
The King County formula logistic regression is computed as follows:
To test for significance of the data, I have conducted a two-tailed 95% confidence interval. When p-values are below a α level of .05, this will indicate that we reject the null hypothesis. The HO is as follows, there is no difference by race or ethnicity in the number of drug convictions when compared to whites (β=0). The HA can be understood as the number of drug convictions is different for each race or ethnicity when compared to whites (β≠0).
Findings
I will present the findings under three categories. I first examine the racial and ethnic disproportionality in drug conviction. I then discuss the relationship between prior drug convictions and new drug convictions. Finally, I discuss the racial and ethnic disparity in drug conviction.
Table 1 presents the summarized statistics for the racial, ethnic, and gender characteristics of convicted defendants in Washington State and King County, averaged between the years 2000 and 2015. Comparing pie charts 1 and 2, and 3 and 4 above demonstrate clear disproportionate numbers when comparing Whites and Blacks in Washington, King County in particular. As the pie charts show, in the state of Washington, Whites comprise 80.7% of the population and 65.49% of drug convictions. Blacks make up a small percentage of the Washington population (4.1%), but an astonishing 5th of the drug convictions (20.08%) - clearly disproportionate. On the other hand, all the other races, i.e. Native Americans, Hispanics, and Asians all have drug convictions relative to or less than their population size in the state.
Table 1: Variables and Summary Statistics for Washington State and King County Drug Convictions, 2000 - 2
Note: The median, mean and standard deviation are each the median value across all years
(Washington State Caseload Forecast Council)
Racial and Ethnic Disproportionality in Drug Convictions
Figure 1 is a line graph showing the number of drug convictions by race and year in the whole state. In terms of aggregate numbers, Whites have a larger number of convictions than non-Whites. For most years, Whites remain above 1,300 drug convictions and display 464 convictions halfway through 2015. Native Americans and Asians are convicted at similar rates in Washington State, staying below 75 drug convictions every year. Native Americans hold 9 drug convictions and Asians have 20 for 2015. Hispanic drug convictions have been on a steady decline since 2000. 2015 shows that Hispanics have 69 drug convictions. Blacks peak with 758 drug convictions in 2000, slowly decrease over time hovering around the 500 line until 2010, and then are convicted of a drug offense 87 times in 2015. When first looking at Figure 1, there does not seem to be a significant disparity in drug convictions for Blacks. However, examination of the proportions of convictions suggest racial disproportionality in conviction rates. I will do this by analyzing the proportions of drug convictions regardless if there has been any prior conviction in Figure 2.
Throughout all sixteen years, Whites in Washington are convicted well under their 2014 population size. In 2012, the year of legalization, and beyond, Blacks experience their all-time lows in conviction rates for drugs. However, despite their smallest percentage at 13% of the drug conviction rate in 2014 and 2015, it is still about double their population size of 6.7%. On the other hand, Asians, Native Americans, and Hispanics are convicted of a drug offense relative or under their population size.
The story changes dramatically when we analyze King County. Figure 3 represents drug convictions in King County.
Although Blacks only make up 6.7% of the population in King County, they still have up to about half of the drug convictions for most years. This shows immense disproportionality in conviction rates. On the other hand, other ethnic and racial groups are convicted at rates under or comparable to their population.
Relationship Between Prior Drug Convictions and a New Drug Conviction
Looking at the Washington drug convictions show that an individual with prior convictions has significantly higher chances of future conviction.
Figure 5 illustrates that every year excluding 2015, Blacks with a prior conviction comprise 50% or more of drug convictions. Again, Blacks are 6.7% of the population in King County. Yet among drug convictions annually, Blacks with a prior conviction comprise up to 65% of those convicted of subsequent drug crimes. This data indicates that Blacks are being re-convicted at much higher rates if they have a prior offense than are Whites, who comprise a majority (70%) of the population. Figure 5 shows that the two lowest fractions for Blacks are in years after legalization. The data set shows an increase in 2013 (60%) but then lows in 2014 (50%) and 2015 (45%).
Figures 4 and 5 suggest that convictions may have been influenced by the passing of Initiative 75 in King County. Both graphs show that in 2002, there were high proportions of Black people who were convicted of drug-related offenses, and the percentage decreases by a few percentage points in 2003. This could be the result of the de-emphasis of cannabis arrests in King County. This percentage drastically reduced after the passing of I-75, from 29% to 13% in Washington, and from 62% to 45% in King County.
Racial and Ethnic Disparity in Drug Conviction
Figures 6 and 7 present the odds ratios computed from the multivariate logistic regression. The model compares each racial and ethnic groups probability of being convicted of a drug offense in King County or Washington to Whites’ probability of being convicted. For example, a value of 1.00 means that a person of that race has the same probability of a White individual being convicted. This would mean that in the year 2000, the odds ratio of 2.68 means that Hispanics in Washington State had a 168% higher probability of being convicted of a drug offense than Whites.
The Washington and King County multivariate logistic regressions are surprisingly different. Figure 6 presents findings for the likelihood of a drug conviction in Washington State. It shows that Hispanics hover above the odds ratio of 1.50 for every year except for 2006. These numbers show that Hispanics are consistently convicted at higher rates than Whites. Blacks also have higher conviction rates in Washington State. Post cannabis legalization, the likelihood of conviction for a drug offense has decreased for Blacks, bringing the rate to almost that of Whites. In recent years, Blacks’ likelihood of conviction has decreased to about 56% of their White counterparts’ likelihood of being convicted. Asians are convicted around the same rate as Whites, never showing disparity.
Figure 7 presents findings for the likelihood of a drug conviction in King County. Asians are convicted at the lowest rates next to Native Americans. For the first ten of the sixteen years of data, Hispanic individuals have over 200% higher likelihood than their White counterparts of being convicted of drug offenses. In 2007, however, the higher likelihood was 673%. Similarly, for most years, Black individuals are 100% more likely to be convicted of a drug offense. However, comparable to the other racial and ethnic categories, post 2012 we see a decrease in the rates of disparity. The logistic regression shows that the probability of getting a drug conviction in King County if you are Black still ranges between 70% and 108% higher likelihood than Whites. Washington State data shows otherwise. Three of the lowest probability ratings come in 2012 and beyond. This data could potentially mean that legalization is having a continuing positive effect on Black communities in Washington. Fewer individuals may be subject to harassment and patrolling because of the nature of the new laws.
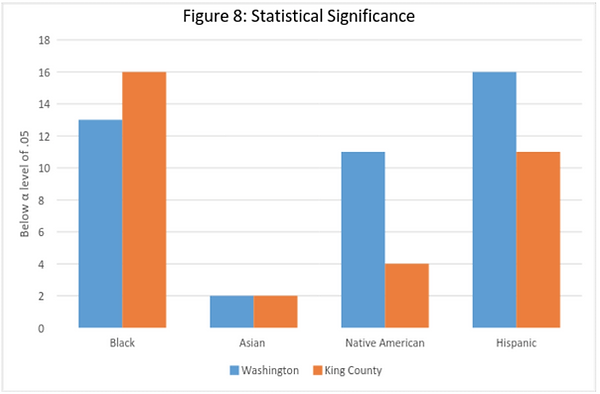
I have also the statistical significance for each race indicator variable using the multivariate logistic regressions. I have conducted a two-tailed hypothesis test with a 95% confidence interval. Figure 8 shows the distribution of how many years each coefficient on race/ethnicity were statistically significant in Washington and King County.
In Washington State, the race indicator for Blacks is statistically significant for 13 years out of 16. This means that the p-value of the observations is below the e α level of .05. Thus, one would not expect these observations to occur by chance more than 1 in 20 times. We fail to reject the null hypothesis for the years 2012, 2014 and 2015. It is noteworthy that these are all years during or post the legalization of cannabis. For every year in King County, the coefficient on a Black race indicator variable is statistically significant.
In Washington, the race indicator variable for Hispanics is statistically significant every year. On the other hand, in King County, the race indicator variable is statistically significant for only five years. The variables associated with Asians and Native Americans have a lower frequency of statistical significance. For Native Americans, eleven out of the sixteen years in Washington State are statistically significant. Disparities seem to vanish for Blacks at the state level in 2012 and during the post-legalization period. Hispanics experience this same alleviation of inequality in King County post-legalization. The data shows that Asians are convicted of drug offenses significantly less than Whites.
Conclusion
The United States is currently facing a problem of mass incarceration. Jails and prisons are disproportionately populated with people of color. Prior research has shown that Blacks and Hispanics are convicted at higher rates for drug offenses. Some scholars have attributed this to the negative media portrayals of these communities. These biases may have been internalized by police departments and have created unequal enforcement regarding drugs. For example, crack cocaine is seen as more deviant and penalized much heavier than cocaine. The difference is that crack cocaine is associated with poor urban Blacks (Beckett, Nyrop, Pfingst and Bowen, 2005).
In this paper, I conduct a longitudinal study of drug convictions in Washington State and King County. My findings suggest that drug convictions in Washington and King County have decreased over time. Further research should be conducted to understand if this decrease in drug convictions may be attributed to a decrease in cannabis convictions specifically. A major limitation of my data is that all drug convictions are grouped together. Different drugs are not penalized the same way by criminal justice systems. Racial and ethnic groups may also be convicted at different rates depending on the substance. Overall, the data shows that in Washington and especially in King County, there is a great deal of racial and ethnic disproportionality in drug conviction rates, and racial disparity in drug convictions. Whites have an extremely low probability of being convicted than Blacks and Hispanics.
Figure 4 and 5 shows that there is a significant impact of having a prior conviction on the probability of being convicted for a drug offense. In King County every year, Blacks have the highest proportion of drug convictions with the condition of having a prior conviction. This supports prior research in New York City that indicates the likelihood of a conviction increases substantially with the number of prior arrests (Golub, D. Johnson and Dunlap, 2007). Further investigation is necessary to explore why Blacks with a prior offense are being convicted at such higher rates within King County than Whites.
Despite the unequal conviction rates, post-legalization in King County does seem to alleviate the racial disparity in drug convictions. The high proportions of non-White individuals convicted for drug offenses in King County may indicate that the policing practices are much different than other counties in Washington. Individuals of color have historically been under heavy surveillance by law enforcement that have institutionalized racial inequality and is perpetuated in conviction after conviction. The effects of the legalization of cannabis may benefit communities of color. The legalization of cannabis may lead to a decrease in racial and ethnic disproportionality and disparities in criminal justice contact for communities of color.
References
American Civil Liberties Union. “The War on Marijuana in Black and White: Billions of Dollars
Wasted on Racially Biased Arrests.” ACLU, 2013. (https://www.aclu.org/files/assets/aclu-thewaronmarijuana-rel2.pdf)
Alexander, Michelle. The New Jim Crow: Mass incarceration in the age of colorblindness. The New
Press, 2010.
Anderson, D. Mark, Benjamin Hansen and Daniel I. Rees. “Medical Marijuana Laws, Traffic
Fatalities, and Alcohol Consumption.” Journal of Law and Economics Vol. 56(2): 333-369, 2013.
Athlerley, Loren T., Mark Baird. “Public Possession of Legal Marijuana.” Seattle Police
Publications, 2014.
Bullock, H. E., Fraser Wyche, K., & Williams, W. R. “Media images of the poor.” Journal of Social
Issues, 57(2), 229-246, 2001.
Beckett, Katherine, Kris Nyrop, Lori Pfingst and Melissa Bowen. “Drug Use, Drug Possession
Arrests, and the Question of Race: Lessons from Seattle.” Social Problems, Vol. 52(3),
2005: 419-441.
Beckett, Katherine, Kris Nyrop and Lori Pfingst. “Race, Drugs and Policing: Understanding
Disparities in Drug Delivery Arrests.” Criminology, Vol. 44(1), 2006: 105-137.
Bonnie, R. J., & Whitebread, C. H. “The forbidden fruit and the tree of knowledge: an inquiry
into the legal history of American marijuana prohibition.” Virginia Law Review, 1970:
971-1203.
Burston, Betty Watson, Dionne Jones, and Pat Roberson-Saunders. “Drug Use and African
Americans: Myth versus Reality.” Journal of Alcohol and Drug Education, 40, 1995:19-39.
Caulkins, J. P., Kilmer, B., Kleiman, M. A., MacCoun, R. J., Midgette, G., Oglesby, P., & Reuter, P.
H. “Considering marijuana legalization: insights for Vermont and other jurisdictions.”
Rand Corporation, 2015.
Census. “QuickFacts: King County, Washington.” 2015. Retrieved December. 7, 2015.
(http://www.census.gov/quickfacts/table/POP060210/53033)
Drug Policy Alliance. Marijuana Legalization in Washington After 1 Year of Retail Sales and 2.5 Years
of Legal Possession. New York. 2015. Retrieved May. 14, 2016. (https://www.drugpolicy.org/sites/default/files/Drug_Policy_Alliance_Status_Report_Marijuana_Legalization_in_Washington_July2015.pdf)
Golub, Andrew, Bruce D. Johnson and Eloise Dunlap. “The Race/Ethnicity Disparity in
Misdemeanor Marijuana Arrests in New York City.” National Development and Research Institutes, Vol. 6(1), 2007: 131-164.
Guttmannova, K., Lee, C. M., Kilmer, J. R., Fleming, C. B., Rhew, I. C., Kosterman, R., & Larimer,
M. E. “Impacts of Changing Marijuana Policies on Alcohol Use in the United States.” Alcoholism: Clinical and Experimental Research, 40(1), 2016: 33-46.
H. Skolnick, Jerome and John Dombrink. “The Legalization of Deviance.” Criminology, Vol. 16(2),
1978: 193-207.
Inciardi, James A. “Marijuana Decriminalization Research.” Criminology, Vol. 19(1), 1981: 145- 158.
King County. Statistical Profile on 2000 Census. 2000. Retrieved on May. 13, 2016.
L. Kutateladze, Besiki, Nancy R. Andiloro, Briana D. Johnson and Cassia C. Spohn. “Cumulative
Disadvantage: Examining Racial and Ethnic Disparity in Prosecution and Sentencing.”
Criminology, Vol. 52(3), 2014, : 514-551.
Levinson, J. D. “Forgotten Racial Equality: Implicit Bias, Decision making, and
Misremembering.” Duke Law Journal, 57(2), 2007: 345–424.
Massey, Douglas S. Categorically Unequal. New York: Russell Sage Foundation.
Musto, D. F. (1991). Opium, cocaine and marijuana in American history. Scientific American,
265(1), 2007: 40-47.
N. Yankah, Ekow. ( “A Paradox in Overcriminalization.” New Criminal Law Review, Vol. 14(1), 2011:
1-34.
Rodriguez, S. F., Curry, T. R., & Lee, G. “Gender Differences in Criminal Sentencing: Do Effects
Vary Across Violent, Property, and Drug Offenses?” Social Science Quarterly, 87(2), 2006:
318–339.
Provine, D. M. Unequal under law: Race in the war on drugs. Chicago: University of Chicago Press,
2007.
S. Crawford, Seth. “Estimating the Quasi- Underground: Oregon’s Informal Marijuana
Economy.” Humboldt Journal of Social Relations, Vol. 36, 2014: 118-137.
Seattle, Washington Municipal code 12A.20.060
Sharp, Elaine B. The Dilemma of Drug Policy in the United States. New York, NY: Harper Collins
College Publishers, 1994.
Terry v. Ohio, 392 U.S. 1. U.S. Supreme Court, 1968.
United States Drug Enforcement Administration. Drug Scheduling. 2015. Retrieved Dec. 5, 2015
(http://www.dea.gov/druginfo/ds.shtml)
Washington State Caseload Forecast Council. 2016. Sentencing Data.
Washington State Liquor and Cannabis Board. Frequently Asked Questions on I-502. 2015.
Retrieved Dec. 7, 2015 (http://www.liq.wa.gov/mj2015/faqs_i-502)
Washington State Medical Association. (n.d). Medical and Recreational Marijuana. Retrieved
April. 29, 2016